Harassment Plants: Exploring How Visualization Design and Situatedness Evoke Compassion in the Wild
Nazareno Andrade, Dandara Sousa, and I published a work entitled \Exploring How Visualization Design and Situatedness Evoke Compassion in the Wild at Eurovis 2022.
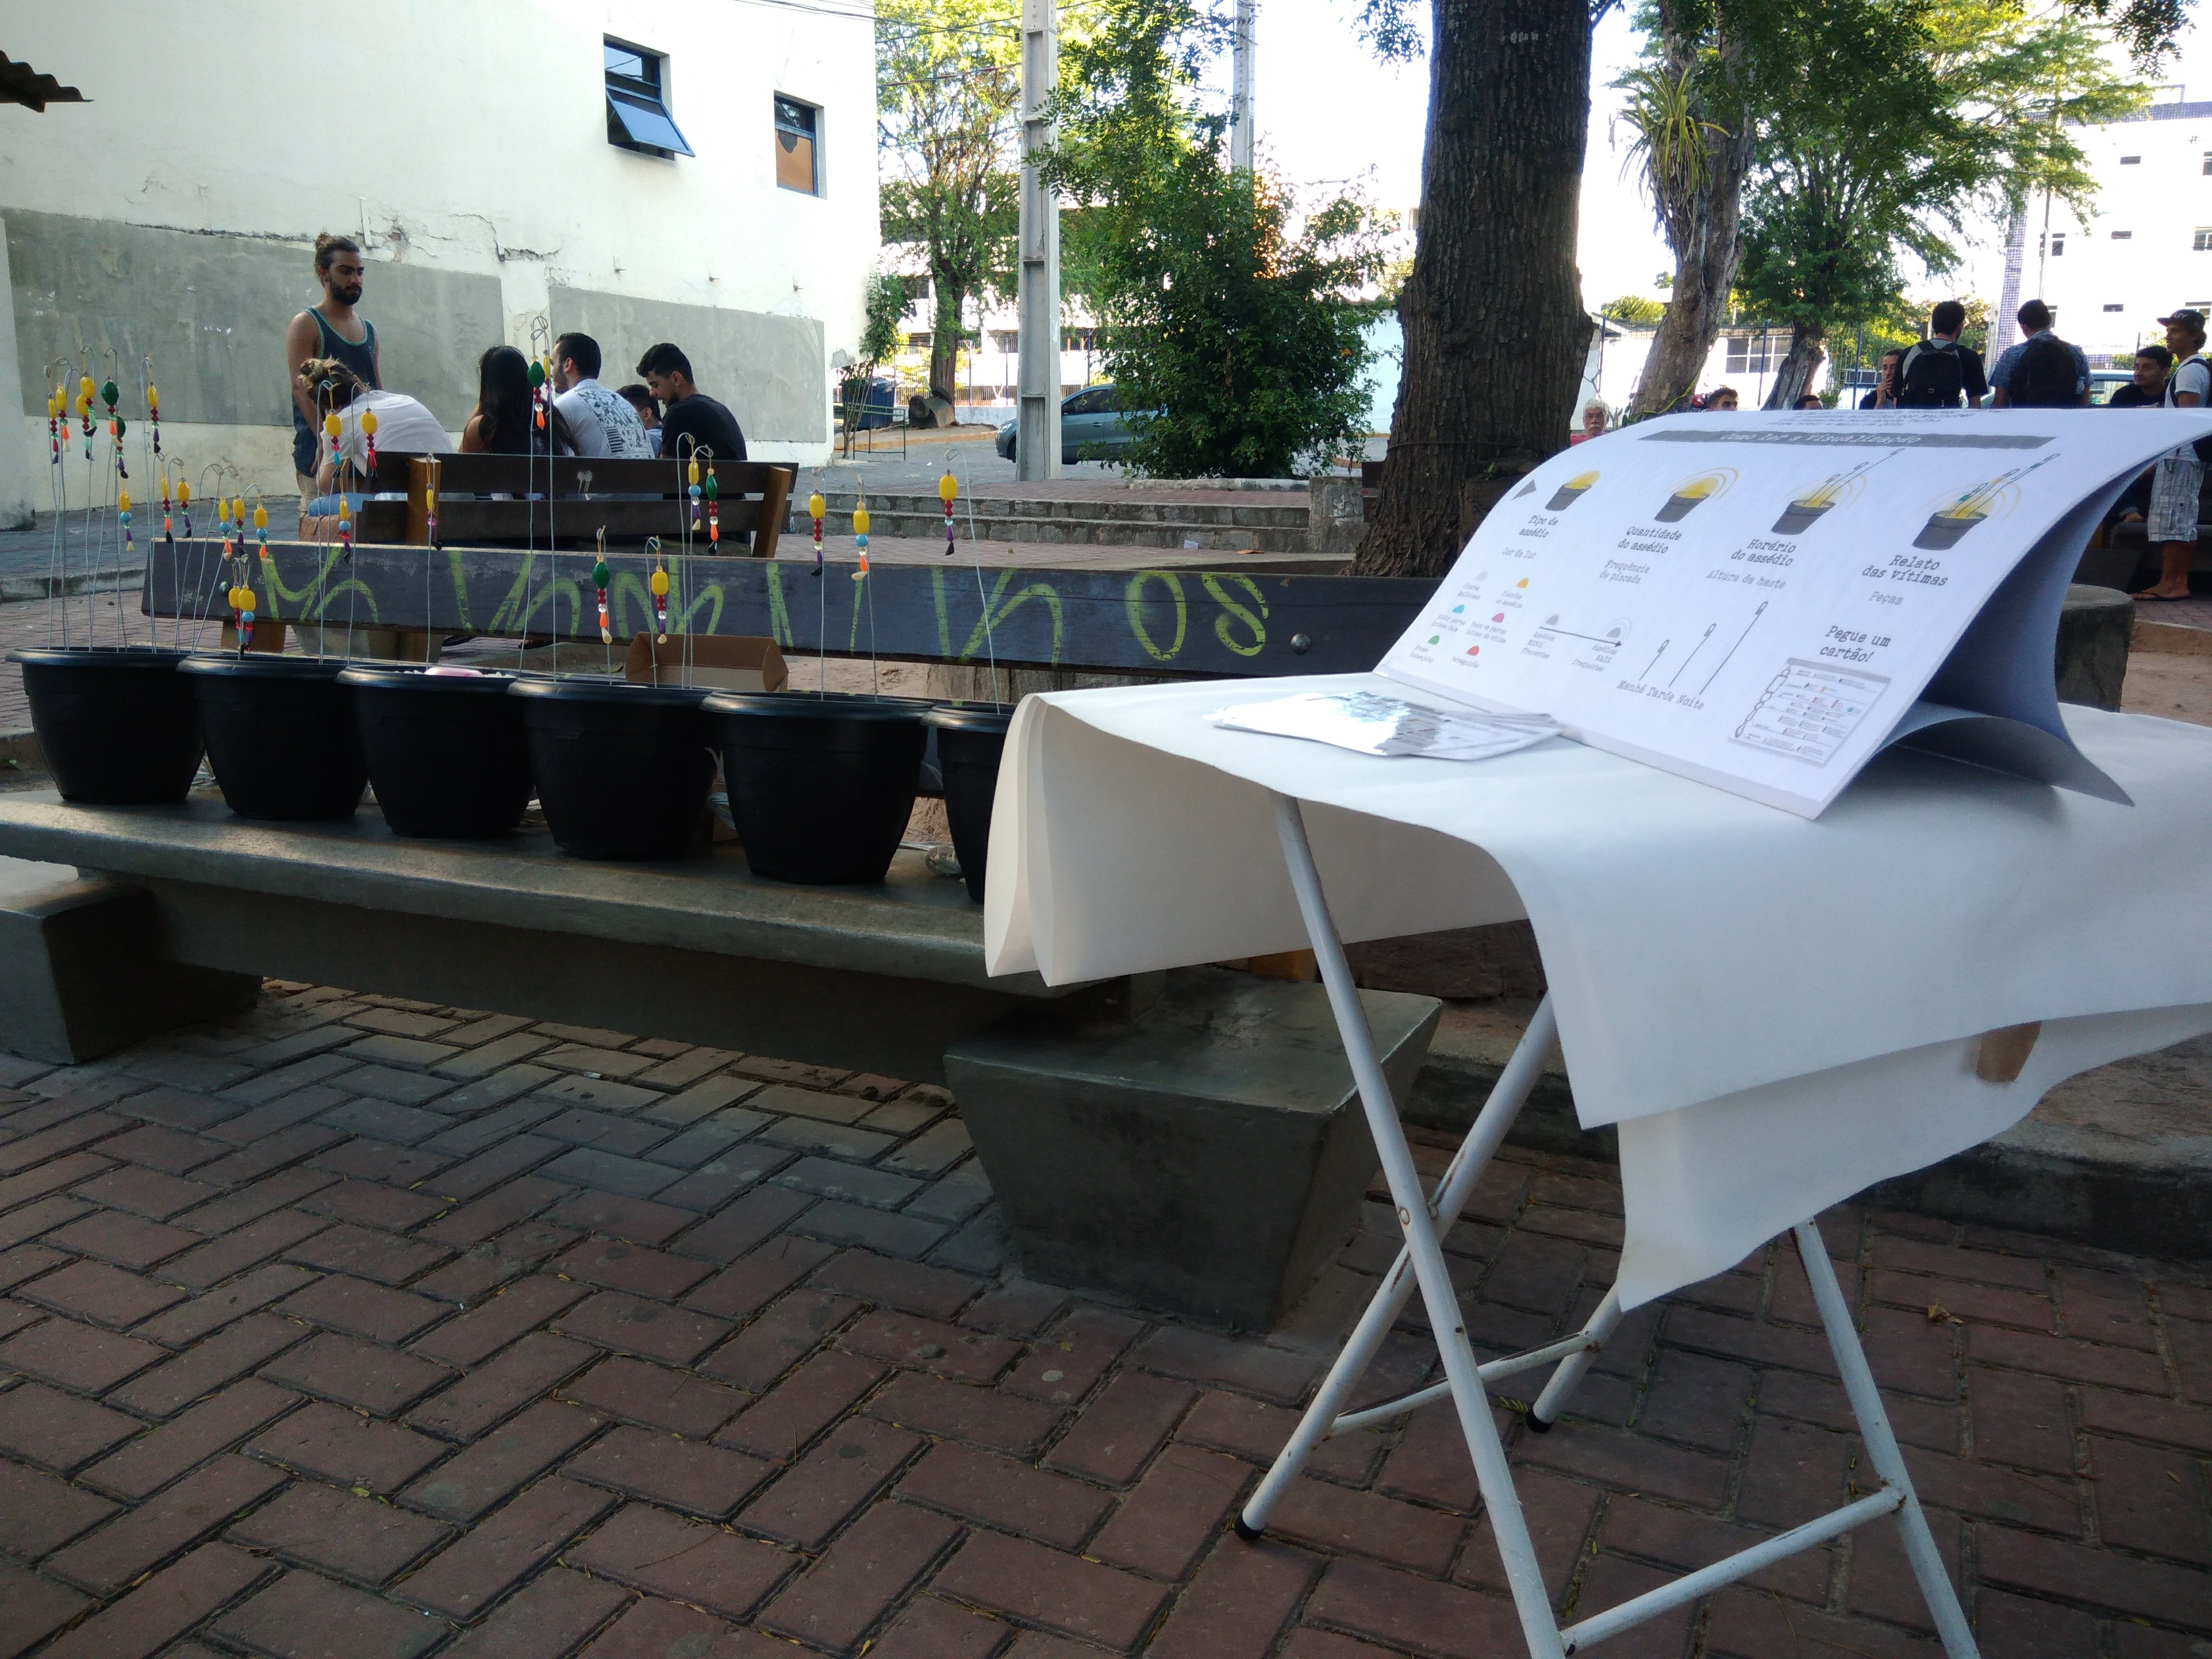
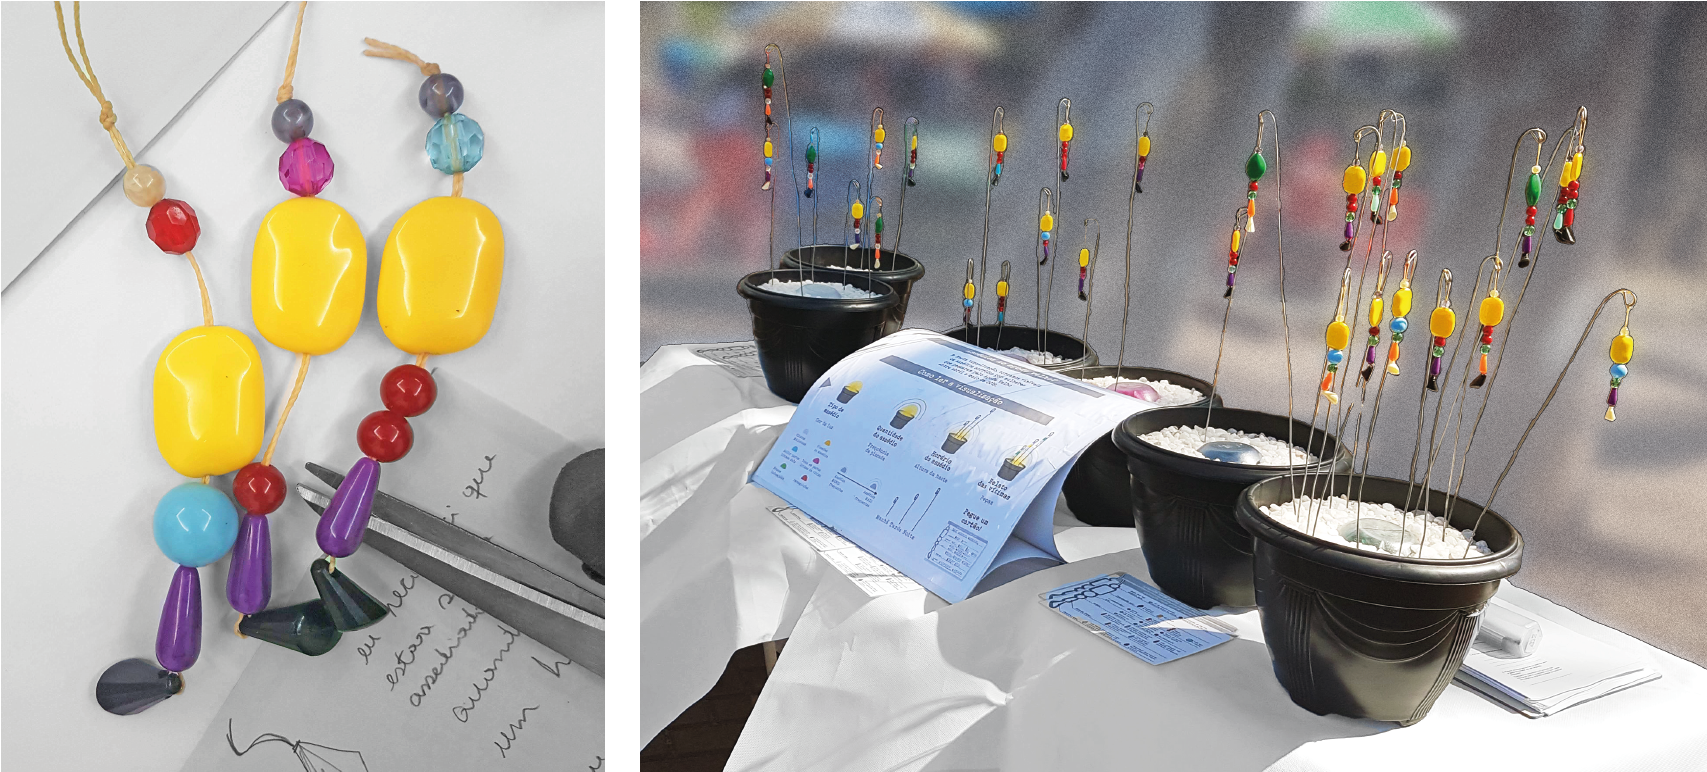
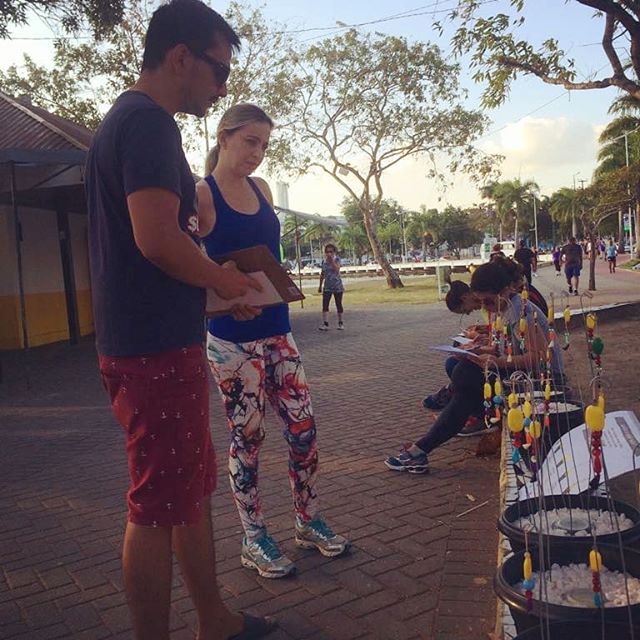
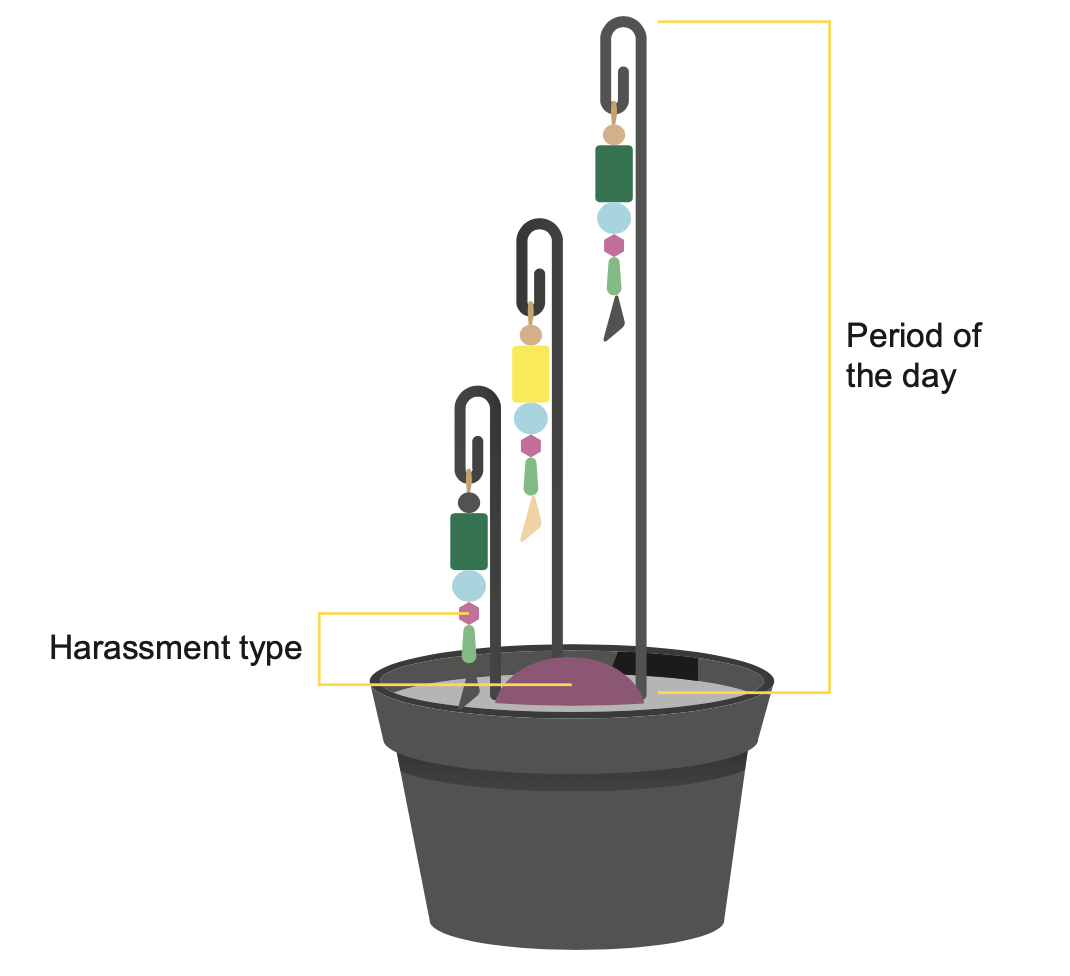
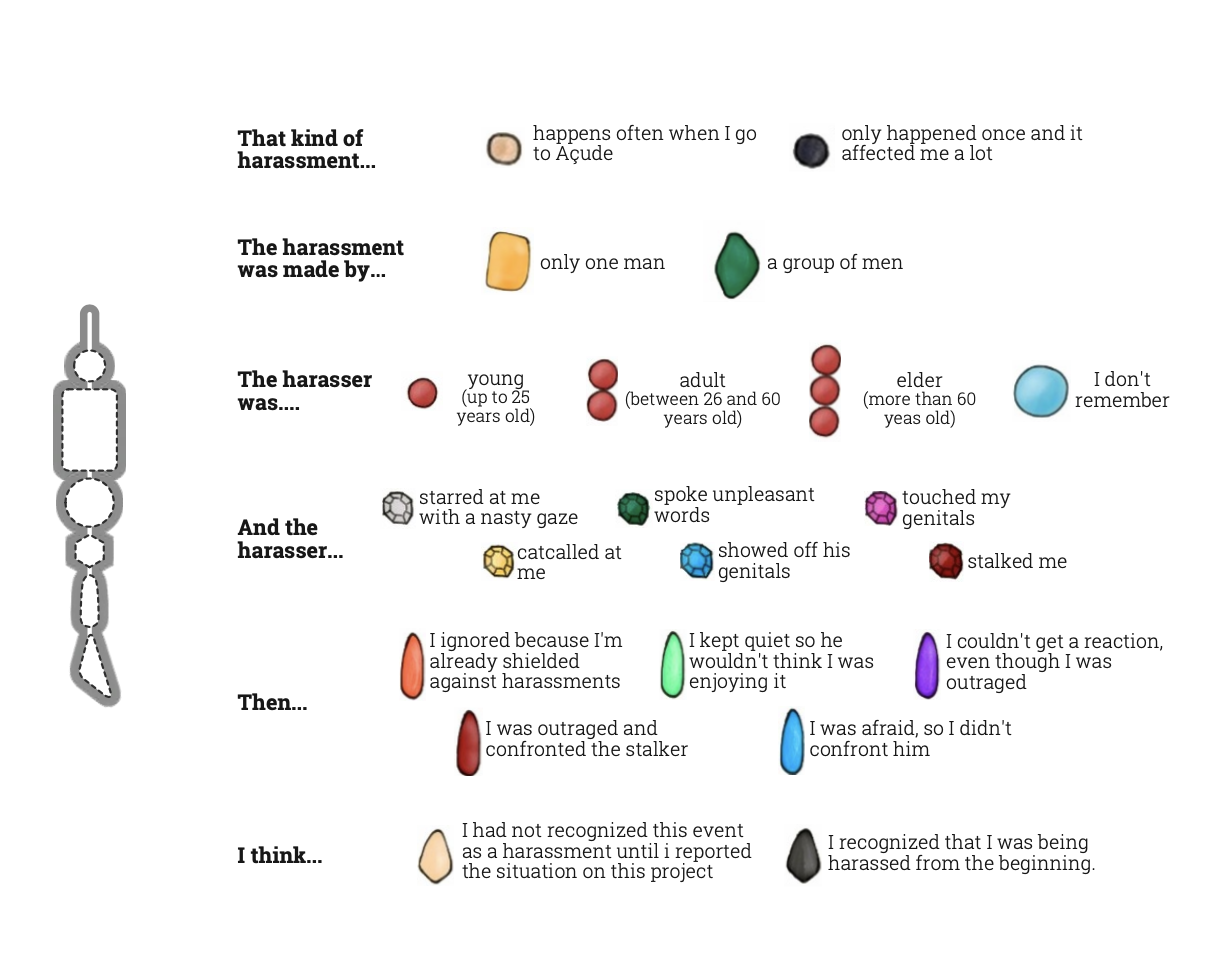
This work explores how the design and situatedness of data representations affect people’s compassion with a case study concerning harassment episodes in a public place. Results contribute to advancing the understanding of how visualizations can evoke emotions and their impact on prosocial behaviors, such as helping people in need. Recent literature examined the effect of different on-screen data representations on emotion or prosociality, but little has been done concerning visualizations shown in a public place – especially a space contextually relevant to the data – or presented through unconventional media formats such as physical marks. We conducted two in-the-wild studies to investigate how different factors affect people’s selfreported compassion and intention to donate. We compared three ways of presenting data about the harassment cases: (1) communicating data only verbally; (2) using a printed poster with aggregated information; and (3) using a physicalization with detailed information about each story. We found that the physicalization influenced people to donate more than only hearing about the data, but it is unclear if the same applied to the poster visualization. Also, passers-by reported a likely small increase in compassion when they saw the physicalization instead of the poster. We also examined the role of situatedness by showing the physicalization in a site that is not contextually relevant to the data. Our results suggest that people had a similar intention to donate and levels of compassion in both places. Those findings may indicate that using specific visualization designs to support campaigns about sensitive causes (e.g., sexual harassment) can increase the emotional response of passers-by and may motivate them to help, independently of where the data representation is shown. Finally, this work also informs on the strengths and weaknesses of using research in the wild to evaluate data visualizations in public spaces.
More information
The paper is available here.